%2024.svg)
I led the UX Design process alongside a UX Researcher from Georgia Tech. We worked with CGHE leaders, their social media team and a development agency.
Conducted 4 user interviews and 3 usability tests, ideated dashboard workflows that allowed users to study data at different granularities, iterated on usability test results.
Wireframe, Research Findings, Long term and Short term goals
4 months

We collaborated with CGHE to redesign their data dashboards. Over 4 months, we worked on understanding their goals, the users goals, the developers goals and translating it into a user-centered design that adhered to the existing design system.

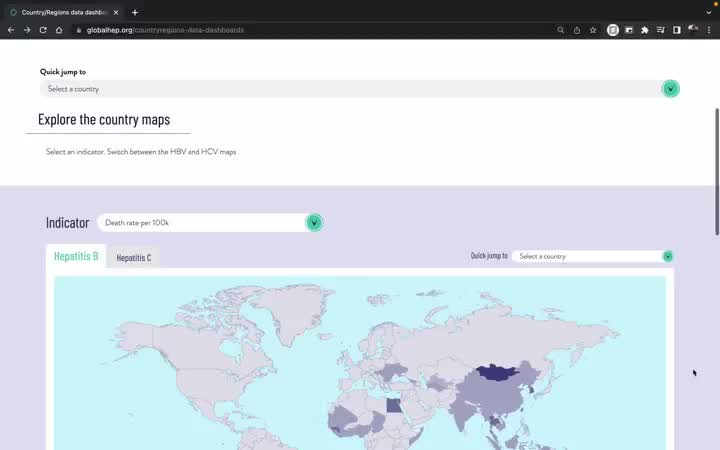
CGHE was launched in 2017, as an initiative for hepatitis elimination. The current website was designed by a development firm, at a time when the available data and resources were low. Since then, the CGHE has grown exponentially and now attracts about 2000 new users every month.
CGHE has a diverse userbase consisting of epidemiologists, policymakers, professors and medical students. Our user research showed that some users know what they're looking for and prefer not to navigate, while some users take a more exploratory approach.


As a complete outsider to the space of hepatitis elimination, it was essential to familiarize myself with the language and technical terms used in the field. Apart from our weekly calls, I reached out to people from the CGHE for short seminars to gather as much information before beginning user research.

Country Dashboards accounted for the largest share of traffic across the website (22%). Traffic peaked across the year especially on days after CGHE held a seminar.
The bounce and exit rate doubled between the world map and country dashboard.
United States (8864), India (2667), and United Kingdom (1281) accounted for the most users in one year.


Our interview participants ranged from policymakers, to workers in government agencies. Being able to interview people across the globe was a learning experience, and helped us gather findings we hadn’t expected.
The interviews were semi-structured and for a duration of 45 minutes. Users were asked to visit the existing website and analyze data as they would during their work. We observed them as they analyzed data at different levels, and asked them questions about their preferences and opinions on the website.
5 out of 6 users talked about major usability issues they faced while navigating through the website. We were surprised to find that some users did not notice key sections of the website altogether.

We asked users if they've used PDFs on the website to understand Hepatitis trends in their country. 3 users did not know they were present, but all the users that used them found it extremely helpful.
Considering that the CGHE was planning to phase-out PDFs, we were surprised to find that some users found it to be more useful than the website.

Our interviews suggested that comparison was a key part of understanding trends for some users.

For some users, visualizations and interactive features helped make complex information more accessible and engaging.

Despite the many issues we noticed, it was essential for us to keep track of what worked well for users in the current website.


From our research responses it seemed like people had various preferences about viewing data. One group of users knew what they wanted and were looking for specific country-related information. On the other hand, the other group of users were exploring and browsing through trends in their countries as well as other countries. I ideated variations of different concepts keeping these 2 user personas in mind.
As seen across our findings, there were certain users that preferred interacting with the map before navigating to their country. I was interested in making use of the free space in the world map to convey extra information that users wished they could see.
I felt the world map would be a great place to include comparison between countries, and get an overview of hepatitis trends before diving deeper into a specific country.

.svg)
There were certain users who preferred the PDFs a lot more than dashboards. However, almost all users complained about the length of these PDFs (~10 pages). My solution to this was to allow users to choose what they wanted to view and be able to export the view as a PDF.
A drawback of this concept was that it would cater to a smaller group of expert users who would know what they were looking for.
My main concept was geared towards redesigning the dashboard to allow users to explore trends at a glance. Throughout our user interviews we were repeatedly reminded that the current tab layout wasn't intuitive to users. Users also complained about feeling lost and confused while scrolling. My solution to these usability issues were to have a sticky sidebar and top bar to help users retain a sense of navigation.
Given the large amounts of health indicators, I was also keen to hide more complex visualizations and data tables behind a "See more" button to prevent the users from getting overwhelmed while skimming through the dashboard.


After recieving client and developer feedback on my concepts, we designed mid-fidelity prototypes focusing on presenting data through the world map, country dashboard, comparison view.

My main goal in this screen was to allow users to compare and visualize multiple health indicators easily using the hover interactions.

An overview of the layout change in comparison to the existing layout.

Allowing users to compare trends across two countries through a side-by-side view.
A key part of the redesign was the use of individual health cards to better segment different pieces of data.
1. During interviews, users responded positively to visualizations that included color cues. Allowing users to get a quicker understanding of what the data was saying while scrolling was one my key areas of focus.
2. While the existing website consists of detailed data visualizations on a separate tab, the redesigned cards would link each indicator to a pop-up consisting of more data. This was in response to a user not knowing that detailed visualizations were present in another part of the website.


Once we had a mid-fidelity, interactive prototype in place, I designed a study to gather feedback on our key concepts. For our research method, we followed a task-based think aloud usability test. Users were given a total of 6 tasks, and asked to rate their comfort level on a scale of 1-5 after performing each task. The tasks involved:
Participants were given a few minutes to orient and understand each view before being alotted a task. While a few users took the time to understand different interactions that were possible, few users were not able to locate the toggle button for comparison. Few users could also not understand how overview indicators could be increased in the world map. This was unexpected and suggested that the design needed to be more intuitive and simple.
The redesigned dashboard was positively recieved by users. They appreciated not having to scroll too much before seeing key health data in comparison to the existing design. They found the cards to be cleaner and easier to understand through the visual cues.
Users spent time exploring the world map and compare between countries as they hovered over them. They reacted positively to being able to see a side-by-side view of the countries.


Our usability tests suggested that our interactions to add health indicators to the overview box were not obvious enough. In order to make the interaction more obvious to the users, I redesigned the box to include a settings page that would allow them to add or remove health indicators.
Instead of having to hover over another country and viewing comparison reults in the overview box, I included results in another box that appeared on hover, to make the interaction as intuitive and simple as possible.

During usability tests users emphasized that they liked being able to see the most relevant information in the first view. Building onto our progress in that aspect, I added a section that allowed users to get a quick overview of a country before diving deeper into its health data.
In the usability tests, users found it difficult to navigate between the different data views. Some users struggled to switch on the comparison mode. As a result, in the final iteration, I focused on making segementations between different views more clear and central to the experience.

Keeping in line with user feedback in the first round of interviews, I focused on designing simple visualizations that communicated trends over time to users through colors.
Additionally I chose to include unit visualizations wherever possible, as I felt that visualizing the people affected in this way would have more impact.
The exisiting website consists of data visualizations which are hidden deeper in sub tabs. In order to make them more visible and structured, I decided to directly link health indicators from the overview tab to a more detailed view about all data collected on those indicators.
More importantly, this view also allows users to visually compare trends within their country with upto 3 other countries.


This view allows users without a specific indicator in mind to scroll and compare trends across 2 countries.
While in our previous iteration the cards were side-by-side, I redesigned them to fit into one card, in order to make more efficient use of the space. Staying consistent with other views, users have the option of comparing trends visually as well as numerically.
In our user research, there were a group of users that loved being able to print PDFs for their stakeholders meeting. They liked having everything in one place, but however, complained about the length of these reports. This feature allows them to generate their own reports, and be in control of what they are printing.

This was my first UX project, working with different stakeholders as well as users all around the world. This posed some unique challenges but made it a rewarding experience. Through our client calls, developer meetings, and focus group meetings, I learnt how to take various perspectives into account while designing. We were fortunate to be connected with CGHE's diverse userbase. Talking to users from a diverse list of countries such as Ghana, Gabon, and Moldova, was challenging due to the communication barrier and helped me learn ways to make my research questions more accessible to people around the world.
In our first month, we were overwhelmed by an entirely new space. We didn't know the problems we would be solving for CGHE and nor did we understand several health shortforms that came up in our communications with the CGHE. Using this as an opportunity to learn instead of getting intimidated, we scheduled two hour long calls with the CGHE to give us a seminar on epidemiology and Hepatitis.
As I became more familiar with the space, I found myself enjoying the process of simplifying and organizing the UX of data exploration. Looking back, I feel a sense of satisfaction to have designed user flows for interacting with data at different granularities.