

%2024.svg)


As the volume of data increases exponentially everyday, about 50-80% of a data scientists time is spent on making sense out of large datasets. Despite the slowly increasing trend in automating different parts of the DS lifecyle, and increasing usage patterns of autoML tools such as VertexAI and AzureML, data exploration continues to be a painstakingly time consuming and manual process. My user research has shown the various ways in which data scientists handle these tasks when faced with time pressure, some of which can be detrimental towards the quality of models generated.
By integrating automation in the workflow of a data scientist in a controlled manner, Plato aims to assist and accelerate their knowledge discovery process, while making sure the human remains in the drivers seat. Keeping in mind the curiousity and creativity that is necessary for this exploration, the focus of Plato is to steer away from complete automation and look to augment human capabilities through data visualization and pattern discovery.


Bridging the gap
“...auto insight tools informed by user studies in specific domains is scarce. Without significant understanding of users the new applications identified may be divorced from real world needs.”
Stasko & Endert, Characterizing Automated Data Insights, 2020
Primarily focusing on redesigning the data exploration module of an existing autoML tool, the goal of this project is to leverage user-centered design to augment human capability in a controllable and trustable manner. Through findings from 10 semi-structured user interviews and literature, following are the research areas I am exploring through my design:
.png)

Weather On-the-Go allows users with visual impairments to build a customized and integrated weather notification system to help them plan their trips. In contrast to a design focused project, this project looked to adopt a more exploratory approach. Our primary goal was not to come up with the perfect design prototype but to further probe into our problem space and look to understand our users. This was a more research heavy project and we placed a lot more focus on coming up with the right questions that would allow us to best study our space. We looked to do this through a lot of literature review and by mainting constant touch with our interviewees through interviews.
Weather plays a central role in all our lives. The conditions around us dictate what we wear, what we carry with us, and what our plans are. Its unpredictable nature means that oftentimes it is crucial for us to know about the various parameters that might affect these decisions. The challenge one faces is to study the various numerical information and extract what matters to them.
Early into our research and interviews, it became increasingly clear to us that visually impaired people face plenty of issues while checking the weather. As a result, this semester, our team looked to explore in-depth how people with visual impairments stay informed about the weather and how we can look to make the experience smoother and more personalized for them.
Some of the probing questions that our research revolved around are:
1. How are target users accessing current weather?
2. In what contexts are they checking for current weather?
3. Are they employing the use of any assistive technology or devices to access weather data?
4. Are there any differences in how they access weather data in private and public spaces?
5. Do they have to rely on auditory methods for weather data? Is it multi-modal or does it involve only one sensory stimulus?


Goal : The key goal of this first substantive part of the project was to deeply understand the problem space that we are addressing, the stakeholders, define the audience we are catering to, and the issues and constraints that are involved in the problem.

My contributions & Overview: For this first stage, I took responsibility for conducting the literature review. I explored all the research that has been done in the field of accessible weather over the past 15 years. I then narrowed down my research and established a narrative for the progress made in sonification, haptic visualization, and multimodal interaction.
Along with my team, I then looked to formulate research questions around which our project would be focused over the next few months. Based on these questions, we roughly ran over the potential solutions, the methods we would follow and the resources we will need.
I then visited the Centre for Visually Impaired in Atlanta to talk to a few people there about our project. I noted down details of one volunteer who was enthusiastic about being interviewed at a later stage. I talked to the director of the center who helped me put up an advertisement for interested volunteers in the weekly newsletter. Plamen, Linda, and Sejal looked to reach out to some of the other stakeholders we identified, for interviews that we would conduct in the next phase.
We started off our project by identifying who our audience and stakeholders would be. After concluding that our primary audience would involve GT students, we subdivided the user group into smaller groups. This helped us each narrow down focus on the specific people we want to recruit for interviews.
image grid
I conducted a design space critique for 2 of the more popular carpooling applications in the US app store.


Before we moved further with our project, it was important for us to define the larger social and technical context in which our design will intersect. For this, David looked to establish the context in Georgia Tech while I looked into the recent developments in the city of Atlanta.
Georgia Institute of Technology

Researching into the role of sustainability on campus, I found that it takes an increasingly central focus under the leadership of Georgia Tech's newest President Ángel Cabrera.
Soon after his investiture last fall, President Cabrera began a project in early Spring 2020 that laid out sustaiable goals. It has continued to gain momentum, through the events of the recent months as environmental sustainability has become ever more important in the life of a global pandemic and increasingly evident effects of the climate crisis.
fdfdfd
fdsfs
sfsdf

While exploring this space I noted that the a lot of the research done points out to the limitations of native screen readers. Papers talk about how this mode of interaction is not optimized for reading weather paramters. As an alrernative researchers have looked to incorporate different modes of interaction to understand weather data. This would allow the visually impaired user to have a more complete and smoother experience.
Sonification and Haptic Feedback were two areas that have been heavily researched for conveying data in a more accessible manner. Throughout my review I looked towards exploring their advantages and disadvantages.
My research concluded that while methods such as sonification and haptic feedback make data interpretation a lot more interactive, they cannot, by themselves, be used to compensate for the loss of vision. A multimodal approach must be adopted to make use of the different sensory experiences of the visually impaired user and give them a data interpreting experience closest to that of a person with clear vision.
However, there was very little research that has been done with respect to utilizing multimodal interaction to help visually impaired people check the weather. Moreover, no work has been done to design a multimodal experience keeping in mind the different environments that visually impaired people might be in throughout their day. I suggested to my team that this is the gap that we could look to explore during our next phase of interviews.
Using these gaps found in our literature survey to direct our interests, we looked to explore how urban adults with visual impairments and blindness currently access information about the current weather, i.e., status for a twenty-four-hour period.
Since neither of us had any knowledge about our user group, we looked estabilish a set of research questions that would allow us to understand them better. I noted down some of the probing questions that we had in mind for the next phase of our research:
1. How are ourtarget users accessing current weather?
2. In what contexts are they checking for current weather?
3. Are they employing the use of any assistive technology or devices to access weather data?
4. Are there any differences in how they access weather data in private and public spaces?
5. Do they have to rely on auditory methods for weather data? Is it multi-modal or does it involve only one sensory stimulus?
6. What is their experience with accessing current weather?
7. What are their most common challenges?
8. What would they want to change/improve about existing channels of accessing weather information?
Despite having some knowledge of the problems in this space, we made sure to approach our questions with an open mind. At this stage, it was important not to restrict them to a particular area, which is why we continued to explore this space with more general questions, hoping to discover more along the way.
With a clearer understanding of the questions we wished to ask, we agreed on a rough plan we would look to follow to investigate the space. We decided to circulate a survey to obtain some general quantitative data and conduct semi-structured interviews to obtain more in-depth qualitative data.
We identified multiple stakeholders in the process and started reaching out to them. In order to gather data from our user group, we reached out to the American Foundation of the Blind (AFB), and the Center for the Visually Impaired (CVI).
We also anticipated responses from some of the domain experts we reached out to, such as Ike Presley from the American Foundation for the Blind. Combined, these resources would help us develop our interview guide and survey form to gather information on users’ needs.
We agreed unanimously to a schedule that would help us stay focused during the process of the study.


Goal: The key goal of this phase was to use the information gathered in phase 1 to direct our survey and user interviews. And then gather requirements, define them, and look to understand the different user journeys.

My contributions & Overview: To lay the foundation for this stage I communicated the background of our problem space by reporting in a concise manner the scope for improvement that I discovered during my literature survey. Using this, I created a survey so we could investigate these gaps further, and get more clarity on the issues faced. I first broke down the survey into broadly different themes and ran it by the team. Taking the lead, we then discussed the questions that should go into each section.
We then conducted 3 different semi-structured interviews, with Linda and me handling one participant. We structured our interview in a manner that allowed her to ask questions per the script while I crafted more open-ended questions based on the interviewee's responses. With data in hand, each of us broke down our interviews by extracting insights into concise sticky notes. Through the affinity mapping process, I took the lead in organizing the notes into various themes.
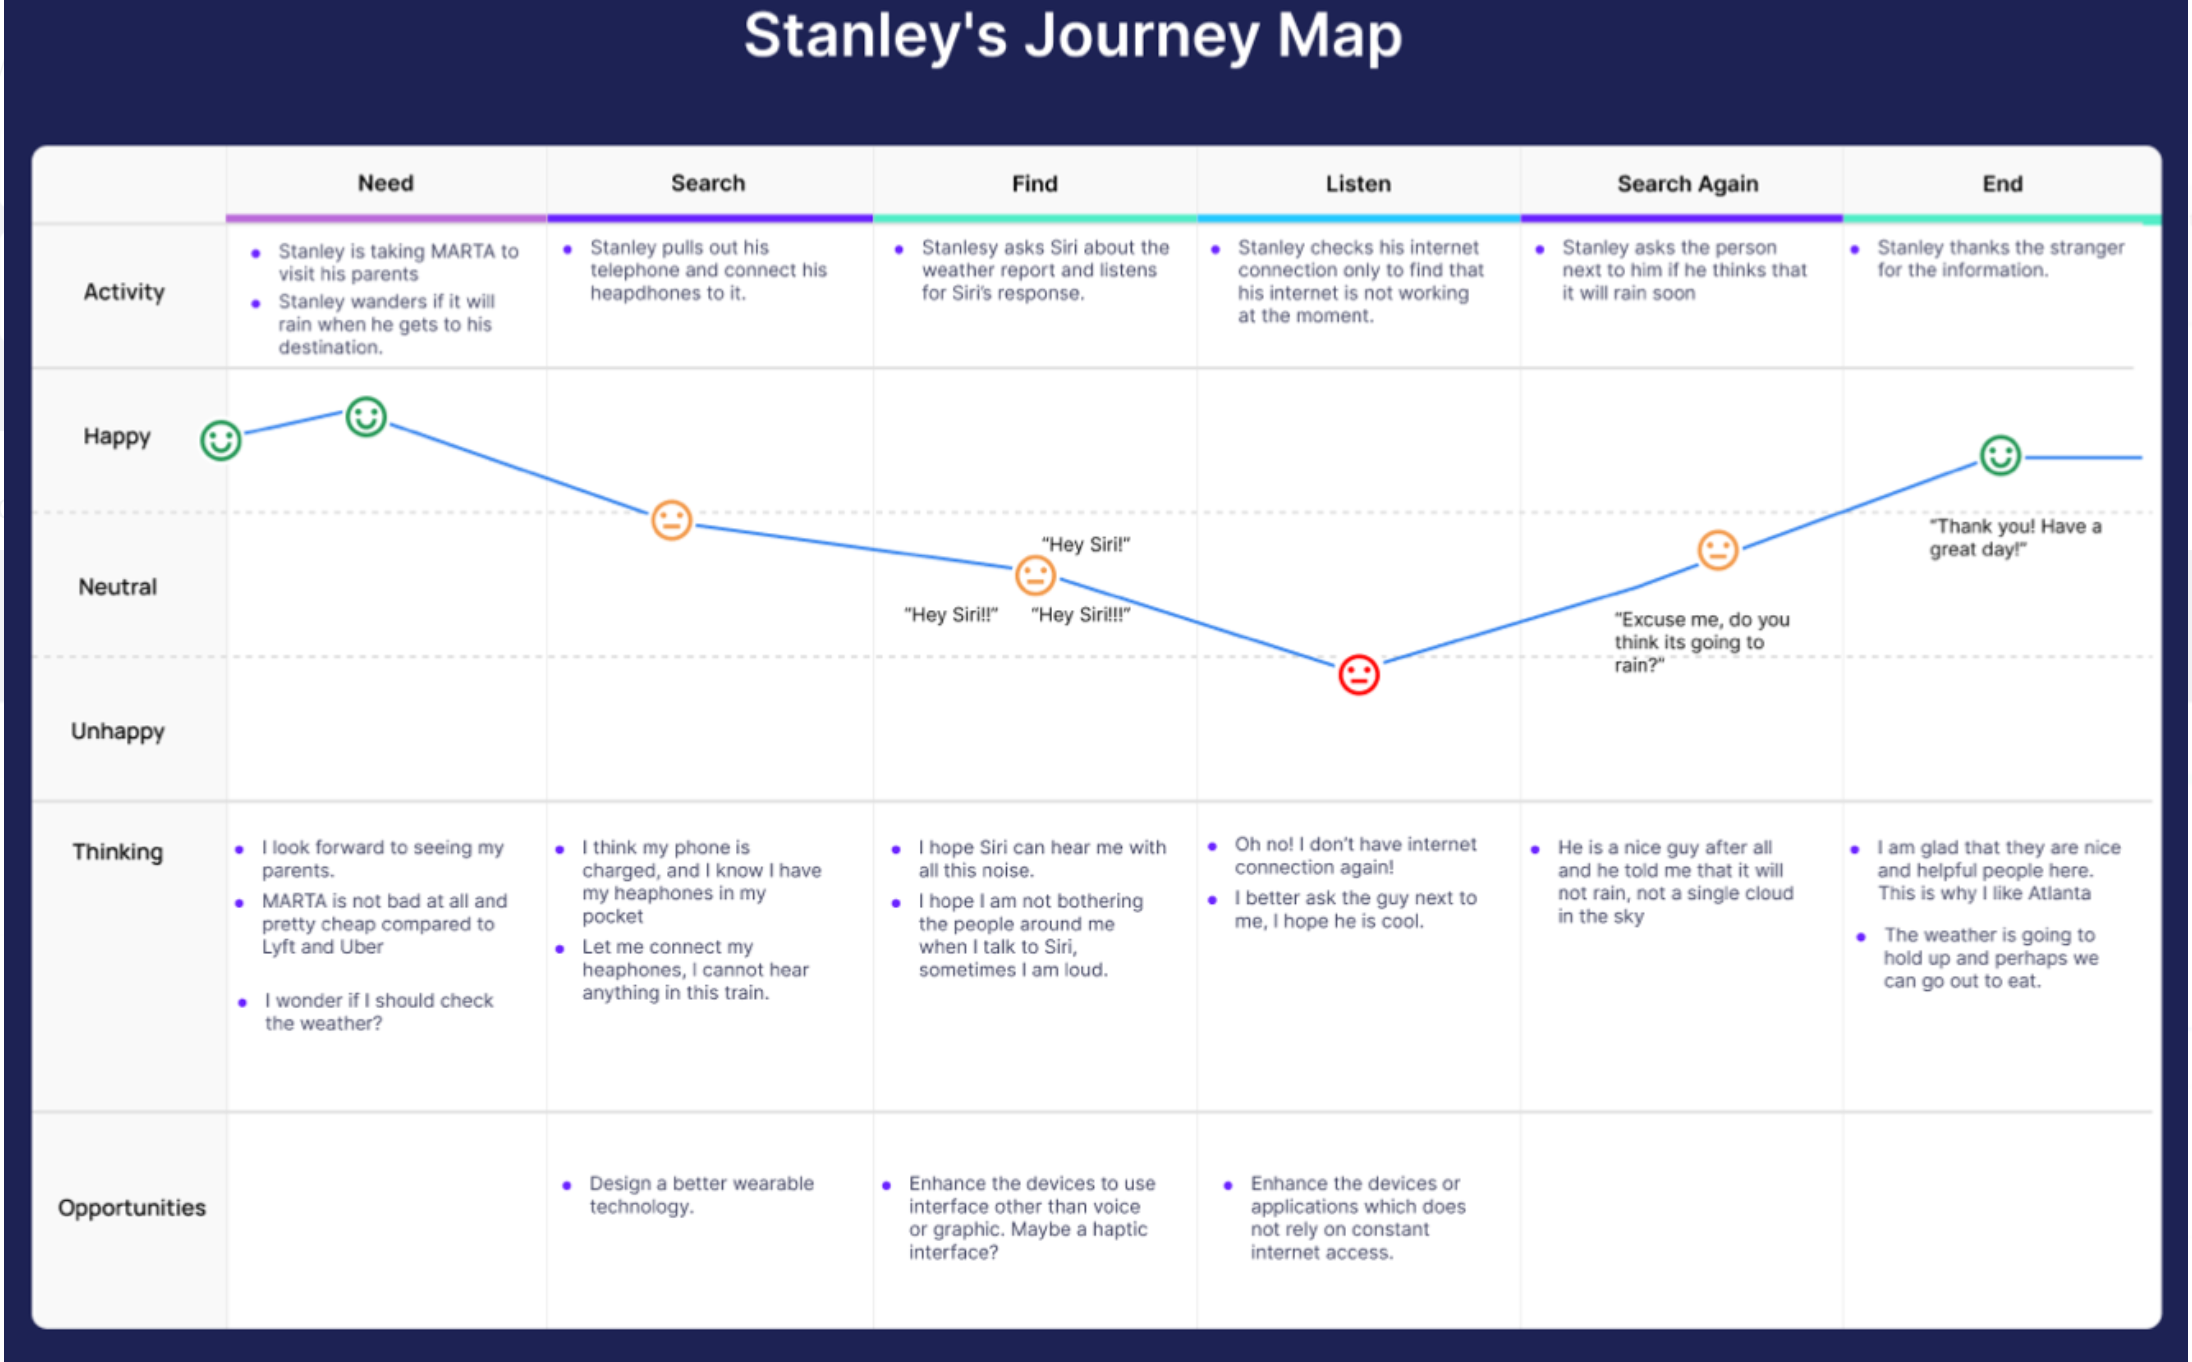
Once we were done with data analysis, I created one persona and worked on 2 journey maps.
Image
A rich text element can be used with static or dynamic content. For static content, just drop it into any page and begin editing. For dynamic content, add a rich text field to any collection and then connect a rich text element to that field in the settings panel. Voila!
Headings, paragraphs, blockquotes, figures, images, and figure captions can all be styled after a class is added to the rich text element using the "When inside of" nested selector system.
images - scamper, task analysis,
fsdfds
kokok
jjj

As sighted individuals, none of us had any experience or informed knowledge about the lived experiences of our user population. In order to do justice to the problem space, we chose to speak with the user population directly to get the data we needed.
We conducted three semi-structured interviews with our user population to understand user needs. The interviews helped us gain knowledge about the users’ motivations, how do they gather weather information, what are their most common frustrations with the existing processes, and helped us answer all our research questions.
I felt that using a semi-structured interview would allow us to engage in a conversation wherein the questions could be altered depending upon the responses given by the interviewee. This approach proved to be crucial as it led us to discover problem spaces that we had not anticipated.
Procedure: Our interview guide was informed by our research questions and the data we gathered from the literature review. The three participants that showed interest were contacted via email. They were introduced to the team and our research topic. All interviews were conducted online using MS teams, Zoom, and Facetime.
During the interview, the interviewee was introduced to the interviewer and the observer. Rapport was built and the interviewee was briefed about the purpose of the study once again. Informed consent was taken, and the interviewee was assured about the anonymity and confidentiality of the interview.
First questions about the interviewee’s demographics were asked, followed by their overall experience with checking the weather. The interview unearthed general concerns the users have and helped us understand their lived experiences when it came to interacting with weather portals and devices. The following table lists out the questions we asked and the rationale behind them.
I took the lead on creating this survey and looked to ask users a defined set of questions that would inform us about their demographics, weather-checking habits, and experience with the existing solutions available to them.
Based on the insights about the different pain points that we gathered from our interviews, we hoped to circulate this survey among our target group in order to gain quantitative data that would tell us the frequency of people who had similar weather checking habits and preferences as of those whom we interviewed. I also hoped to get a better idea about the preferences and habits of age groups that we were not able to interview due to limited resources.
The data that we gathered would allow us to test and confirm some of the hypotheses we developed from our user research and interviews.

Procedure: I structured the survey into 3 broad sections — Demographics, Weather Habits, and Improvement Opportunities. We then started populating each section with appropriate questions.
While we concluded demographic information would help us in identifying potential patterns and relations between demographics and weather-checking habits, my thinking behind the first section was to insert screener questions that would help us filter out the users that did not fit in with our target group.
My aim for the next section was to gain data on the habits and preferences of our users with respect to checking the weather. The responses to these questions would help us realize the portion of users that are similar to those we interviewed, and are exposed to the pain points that were highlighted to us in-depth during our interviews.
Keeping our goal of keeping the survey short in mind, I included three questions at the end of our survey which would tell us how satisfied users are with their current experience, highlight pain points and let us know how open users are to learning a new interaction.
I realized that once users repeatedly use a product they tend to get used to its shortcomings and subconsciously ignore it. Therefore, it was important for me to word the final questions in a way that wouldn’t be leading but at the same time would prompt users to think about a shortcoming they might have been improving.
To compare different resources, we evaluated the ones that our targeted users use. Then we divided the resources into two categories, design features, and assistant tools.
For design features, we decided to evaluate the Weather Channel, iPhone default weather app, and android default weather app based on the interview response. We focused on the experience that users get while they check the weather information using various applications and websites.
Another category is assistant tools, Siri, Alexa, and Jaws, which indicates the resources that users utilize to receive information from specific devices or programs. We looked at the effective and ineffective factors for each different resource and tried to understand the relevance of the resource to our project.

Due to the niche user group, we were looking at, and the time constraints we were unfortunately not able to gather any conclusive data.

For our personas, I thought it was best to focus imagine users who face 2 important issues that we identified during our user research -- the inaccuracy of weather reports and the heavy reliance on internet.
Based on the personas that my teammates further detailed, I focused on creating the specific journey maps.
Ideating through the empathy and journey maps allowed me to put myself in the shoes of our target users. This helped me gain a stronger perspective of their issues and its emotional implications.
1. Angela Yaki
The persona of Angela was designed to imagine users who are inconvienced by the inaccuracy of weather reports.


2. Stanley Wilson
The persona of Stanley was designed to place emphasis on the struggle of our users when there is a lack of network connection.

We then analysed the potential design implications of our findings.


Through our user interviews we learnt that a large perecentage of users liked to spend some time exploring the map and comparing their hepatitis data in their country with neighboring countries. However, as one user pointed out, the existing map was not intuitive enough to support these interactions.
The existing map's focus on being just as an entrypoint to country dashboards was restricting, especially when their users were also interested in deriving comparisons. To realize the potential of this screen in giving a quick overview about trends across countries, I made use of the empty blue space on the map and included a box that would serve as an information point.
I also combined multiple maps on the existing page into a single map, and included a map switcher. Next to it, I added an input bar where users could adjust the overview information they see in the box.

Through user interviews, I learnt that various elements of the existing layout on the right were largely inaccessible to users. The nested tab structure, in particular, was not working with 2 users surprisingly not completely lacking awareness about important tabs that were hidden underneath HBV and HCV. During a focus group session with other HCI researchers, it was agreed that the tab structure for navigation did not feel natural and intuitive.
Keeping all the feedback in mind, I redesigned the page attempting to make sure no navigation elements were nested. On the left side is a cleaner navigation system with a sticky sidebar and radio buttons to switch views between HCV and HBV. The sticky sidebar was important to address user feedback about often getting lost in the page and having to do a lot of scrolling during navigation.
Additionally, I redesigned the cards conveying data to be bigger, in an attempt to give users more visual information while skimming through the page, and reducing the cognitive load. Its contents are detailed below:

During user interviews, users talked about visual infographics being more helpful to them. Graphs that were previously hidden in the nested HBV/HCV tabs, were included in each health card combined with color for visual cues. In addition, users would be linked to a more detailed graph on clicking the "see chart & detailed data button".

Given how common it was for users to compare between countries, it was important to include a feature that allowed them to view a side-by-side comparison. The map allowed users to compare data on a high level, while this view allowed them to go deeper and view all available data for each country.

In addition to the world map, and country dashboards, the PDF report was another channel that users liked consuming data through. However, across 2 of our interviews, users complained about confusing infographics that required them concentrate a lot to comprehend the data. They also talked about how visual cues such as color help them in skimming through documents.
Keeping this in mind, as well as the extremely long length of current PDFs, I redesigned infographics to be more clear and use space efficiently.


Goal: The goal of this phase was to ideate 3 different concepts based on our findings from the previous sessions and settle on one low fidelity prototype based on user feedback.

My contributions & Overview: We began phase 3 by conceptualizing solutions to tackle the various issues highlighted in phase 2. I decided to focus on the heavy dependence on an internet connection for weather data. From the interview data we gathered, and especially from the insights we got from participant #2, I thought this was an area where a lot more work demanded to be done. I, therefore, looked into the idea of creating a local weather station integrated with a wearable such as a smartwatch. Plamen came up with 2 other concepts.
I then proposed and discussed my concept with each of the participants and looked to get their feedback. I asked them various questions to assess their comfort with such a device.
We then collectively planned out the top-voted concept in-depth, and Linda created a lo-fidelity prototype based on our discussions. We then had another session where Sejal went through the top voted concept in further detail, and looked to get their feedback.

The rich text element allows you to create and format headings, paragraphs, blockquotes, images, and video all in one place instead of having to add and format them individually. Just double-click and easily create content.
The rich text element allows you to create and format headings, paragraphs, blockquotes, images, and video all in one place instead of having to add and format them individually. Just double-click and easily create content.
dsfdsfs
kjnnkjj
sdfsdf
Based on our findings from the previous stage, we initiated this phase with 3 concepts that we believed best addressed their concerns.
I ideated concept #2 ie. creating a local weather station using different sensors while Plamen came up with concept #1 and concept #3. They are as follows:

The research we did for R1 and R2 indicated that our users often check the weather while commuting using public transportation such as bus, subway train, Lyft, or Uber.
This design idea is embedded in a smartwatch platform. Smartwatches are now readily available and widely used. Because users wear smartwatches on their wrists, they are easily accessible, which addresses the difficulty a visually impaired person may face while retrieving their smartphones from their pockets in a crowded space.
Moreover, smartwatches have the capability to allow the integration of haptic interfaces enabling the users to issue commands by swiping or tapping their screen. This would address the pain point that we identified in our interviews regarding difficulties among our user group while trying to understand the information transmitted via the voice interface, especially if the user is outside and does not have their headphones.

A few important issues that interviewees highlighted to us were the inaccuracy of weather reports, lack of updates on instant weather changes, and the reliance on stable network coverage for weather updates.
In order to make the process of checking the weather more independent of a network connection, I chose to explore the idea of creating an IoT-based local weather station. A product of this nature could reduce the anxieties of visually impaired people surrounding the accuracy of weather reports, the unpredictability of weather, and the reliability of good network coverage.
I discovered some research has already been done on this end, with an end-product that delivers weather data from different sensors to an LCD display and reports an increased accuracy in comparison to the nearest weather station.
I proposed that a sensor, in particular, that could be integrated would be the Barometric sensor. This sensor comes equipped in most smartphones/smartwatches today and is capable of measuring variations in air pressure which could be used to predict weather data. However, popular companies such as Apple do not allow developers to access these readings yet and continue to use them mainly for other purposes such as altitude measurements.
As a result, a product built from scratch for the purpose of checking the weather could look to leverage capabilities of this sensor, as well as integrate a combination of other sensors such as raindrop module sensor, temperature/humidity sensor -- depending upon the weather data we wish to read.
While researching the different sensors I noticed that Bosch Sensortec recently released a high-performance miniature barometric pressure sensor, BMP384, that would easily fit into wearables. They advertise an advanced technology that promises portability as well as protection against water and other contaminants. Such developments are exciting and boost the feasibility of this solution.

This solution focused on building an effective notification system to remove the anxiety they expressed about weather changes during or before their trip. The application would work in the background to gather weather data for the radius of their trip and deliver a customized weather report based on their various preferences.
This system would aggregate the following information about the user:
- Their current location, and additionally if the user is at home or at their office.
- Where the user is going (future geolocation).
- At what time will the user arrive at their destination?
- The current weather conditions at the user’s current location.
- The weather conditions at the user’s destination upon their arrival.
Users would be able to enter their trip details manually or have it automated for them based on existing behavior.
One way would be to allow them to integrate and sync their scheduled trips with applications such as Uber or Google Calendar. Once the trips are in the system's database, users would be provided with various ways to customize the notifications and how they can interact with the embedded weather report.
Another potential method would be through the integration of deep learning with our application. By observing the users' patterns the system could aggregate data about the user’s schedule and use deep learning to build an internal calendar. This would allow users the convenience to automatically receive smart notifications based on their daily patterns. However, until an accurate model is built for the users' patterns, the user can avail the other modes highlighted above.

After the user opens the application, one will first log in to the login page, where the user can enter the user ID and password. After logging in, there will be four different questions for first-time(new) users. The questions are for the mobile application to filter out various features to fulfill the user’s needs and wants.

After the user completes the onboarding questions, a screen will pop up with a tutorial about the application. Users can either skip or click on the button to hear what features the application contains and to learn how to navigate. After, a user can decide whether to allow the application to access one’s location.
The user then finally will be on the landing page where it indicates the user’s schedule for the day, current weather (if a user allows the application to access one’s location), and linked application that users selected during onboarding screens.

Users can use the navigation bar to see which applications can be linked to and edit them at any time. After users link the app to other apps (such as Uber, Lyft, Marta, Calendar), they will receive notifications from these apps about weather changes. The user can click on the notification and Weather OTG will open a suggestion page. This page will include information about immediate weather changes throughout the journey and what the user must prepare before departure.
The user can use the navigation bar to see one’s account and preference. The screen will contain the information that the user filled out during the onboarding process. This page allows users to easily scroll down and find various preferences, and make any changes regarding receiving notifications, linking apps, and weather information.
The schedule feature could be helpful in a scenario where the user needs to manually input their data about their destination location and estimated time of arrival. This can happen in a situation where the user simply might be going for morning walks and may not have scheduled a calendar event, or a trip on any transit application. It would be implemented by collecting data from AccuWeather and combining it with data manually entered by the user.


.png)

During the usability tests, users found some elements of the new map design to be confusing. Users took sometime to understand the connection between the overview data input box and the overview box. In the final iteration of this design, integrating the two into one box provided a more natural user flow. Secondly, making use of a hover box was a more cleaner and natural way to allow users to compare between different countries.

In the usability tests, users found it difficult to navigate between the different data views. Some users struggled to switch on the comparison mode. As a result, in the final iteration, I focused on making segementations between different views more clear and central to the experience.
Users mentioned they would like to get as much information as possible in the first glance. Another focus of the final iteration was to provide a more comprehensive overview at the first glance.

Our user interviews showed that epidemiologists and policymakers are most concerned about sources of data. This view was focused on users wanting to go deeper and analyze the origin of data points.

I designed the 3rd view to allow users to easily compare between different countries. Staying consistent with other views, users have the option of comparing visually as well as numerically.

In the conceptualizations phase, I advocated for a UX that removes the element of navigation and focuses more on giving everything the users are looking for in one screen.
While a drawback of that approach was that users need to know what they're looking for, a solution we agreed to was integrating it as a feature of data dashboards.
In our user research, there were a group of users that loved being able to print PDFs for their stakeholders meeting. They liked having everything in one place, but however, complained about the length of these reports. This feature allows them to generate their own reports, and be in control of what they are printing.
.png)


Goal: To convert our designs into a high fidelity prototype, and make it accessible to our users for further testing.

My contributions & Overview: Based on user feedback in the previous stage, I and Linda collectively worked on converting the lo-fidelity prototype into a fully functioning application. Our aim was to function more on the functionality rather than design, keeping in mind the visual impairments of our user group. However, it was important for us to also design for those with lower visual impairment. Building on the I then created an interactive prototype integrated with auditory and haptic feedback for accessibility. We then looked to test it with each of our participants as well as a set of experts for further feedback.
We then conducted a heuristic evaluation to conclude this stage and then analyzed the scores.

dfdsdfs
sdfdsfs
fsdfsdfds

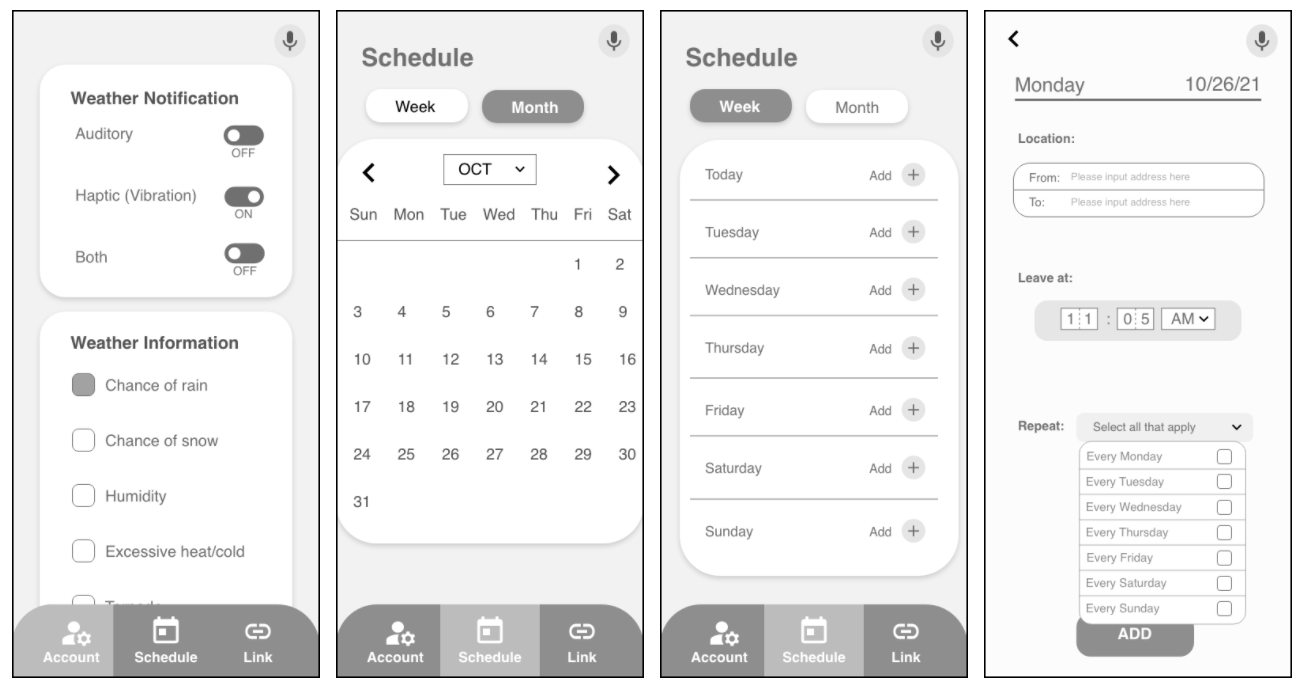
Onboarding: The onboarding screens were designed to gather user preferences on the weather report data, how they would like to interact with the data, and when they would like to receive the notifications.
Keeping in mind the visual impairments of our user group, I made sure that a high contrast was followed throughout all text-based components. Therefore, the color palette for these components was always either black on white or white on black.

Dashboard: The dashboard screens were designed to display data most essential to users -- the current weather, the upcoming trip, weather-based suggestions, and a section to access trips.
The trips feature in particular was conceptualized and designed by me from scratch. I believe, in order to ensure user control and freedom, it was important to have a location in the application where all trips in the database are displayed.

Schedule: The screens above would be used to schedule a trip and add it to the database. While our initial idea was to add trips through deep learning or syncing with existing applications, I believed it was important to give users the option to manually add trips. This would ensure that our application is inclusive of those who aren't using other applications or are not comfortable with being tracked.
Further, I proposed that while entering trip details, it would be important to allow our users the option to dictate their trip details. Once dictated in a particular format, the system would then extract details from their sentences and auto-fill it for them.
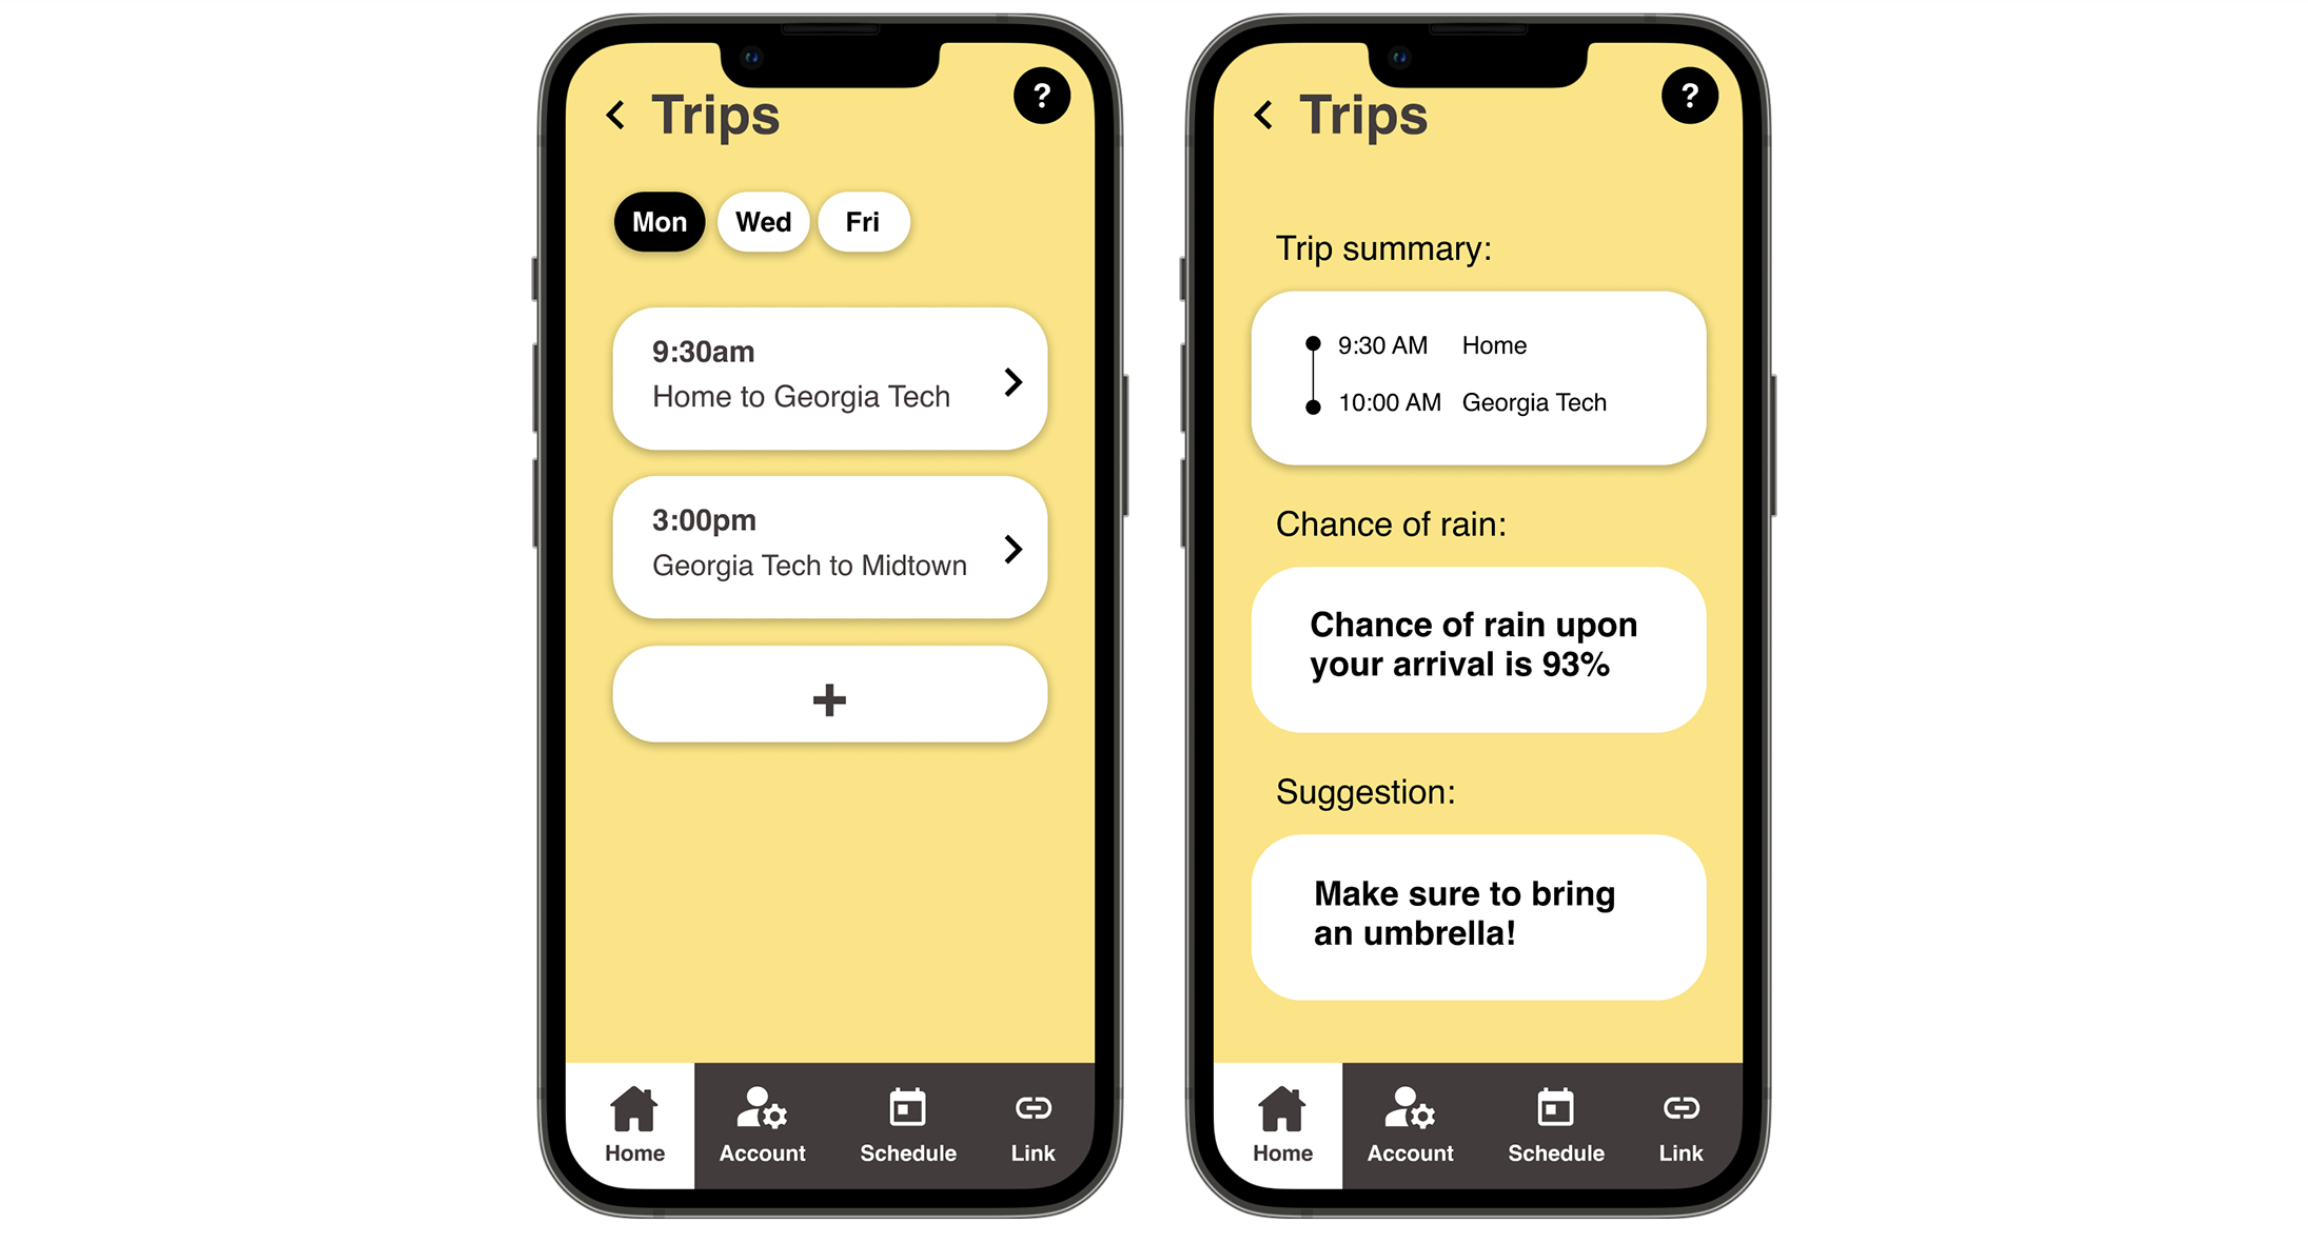
Trips: Building on my idea of adding a trips section, the first screens consisted of an overview of the trips the users had scheduled for the day. I also added the option for them to quickly add a trip for the particular day by using the "+" symbol.
Once users click on a trip, they are directed to the weather report for the particular trip. This report would be populated based on the preferences they had highlighted earlier. Similarly, users could interact with this report either through auditory means, haptic or both based on the preference they had indicated during onboarding.
When users tap on a notification, they would be redirected to this screen consisting of the weather report.

Account: The purpose of this screen is to allow users to go back and change any of the preferences they had indicated during the onboarding.

Links: This screen allows users to connect with any of their existing applications to automatically sync their trips. Once they click on the application banner, they are redirected to the particular application and prompted to allow access.
After that is done, the state of the banner changes to display the successful integration.
We chose to conduct Heuristic Evaluation to get feedback from accessibility experts. As this was the first time any of us were working with accessible design, getting feedback from industry experts was extremely useful for us. We were able to recognize some of the flaws in our design, as well as potential usability concerns.
We had four industry experts with prior expertise and knowledge in accessible design. Our experts had prior experience working with people with visual impairments as well.

We conducted remote, moderated Think Aloud tests with our user population to understand the usability of our design prototype. The main aim of these usability tests was to gauge whether our prototype meets the needs of our users. We wanted to understand whether our users could operate the application by themselves, whether it would help them, and whether they can see themselves using it.
